A dynamical system consists of two components; one describes the state of the system and the other is a function f:![]() that determines its future. The state is a n-dimensional vectorand it is written Xt, where t stands for a time index. If the time index is allowed to run continuously over time, then Xt is a continuous system. In this course we study discrete dynamical systems, for which the time index belongs to the set of natural numbers,
that determines its future. The state is a n-dimensional vectorand it is written Xt, where t stands for a time index. If the time index is allowed to run continuously over time, then Xt is a continuous system. In this course we study discrete dynamical systems, for which the time index belongs to the set of natural numbers, ![]() .
.
The starting point (start-state) is denoted by X0. Later states of the system are calculated by iterations of f(X0). The composition f(f(x)) is denoted by f 2(x), f(f(f(x))) by f 3(x), i.e. the n:th iteration of x is denoted by f n(x). Assumed that the starting point is known, the state of the system at the time t+1 may be calculated by t+1 iterations of X0 :
| X t+1= f t+1(X0) |
The state at time t+1 of a discrete dynamical system is according to [May76]:
| X t+1 = f(Xt) | (1.1) |
Equation (1.1) may for example describe the size of a population [May76]. The interesting thing with discrete dynamical systems is to study the asymptotic behavior of the iterative process (1.1).
The forward orbit of a point x is a set O+ that consits of the points: x, f(x), f 2(x), . . .. The backward orbit of x, written O - , consists of the following points: x, f -1(x), f -2(x), . . ., assumed that the function f is invertible.
A point ![]() is a fixed point if:
is a fixed point if:
| f(x) = x | (1.2) |
The point x is a periodical point with the period ![]() , if:
, if:
| f n(x)=x | (1.3) |
The set of periodical points of period n of the function f is written Pern(f).
| Pern(f) = { x | f n(x) = x } | (1.4) |
The set of fixed points may be written as Per1(f). The point x is a periodical point with the prime period n, if n is the least natural number that satisfies (1.3).
The local stable set of a periodical point ![]() is denoted by
is denoted by ![]() . If the map is invertible, the local unstable set is:
. If the map is invertible, the local unstable set is: ![]()
Definition 1.1. Assume that f: V-->V. The set of periodical points {Pern(f), ![]() } is dense in V if the closure of
} is dense in V if the closure of ![]() = V
= V
The closure of ![]() is the union of all periodical points.
is the union of all periodical points.
Example 1.1. The function g(![]() )=sin(3
)=sin(3![]() ) has periodical points that are dense in S1. For an integer k the following holds: g(
) has periodical points that are dense in S1. For an integer k the following holds: g(![]() +k2
+k2![]() )=g(
)=g(![]() ). The periodical points may be calculated from (1.3) as the following:
). The periodical points may be calculated from (1.3) as the following:

![]()
It’s interesting to study the qualitative changes in the periodical points as the function f changes. The periodical points may be stable or unstable. The classification of these are described in the next chapter.
The classification of fixed and periodical points in one-dimensional systems may be done by the derivative [Dev89]. Assume that ![]() , the point p is said to be:
, the point p is said to be:
When choosing a start point x0 from an open interval around a periodical point the behavior of the forward orbit depends on the map. If the periodical point p is hyperbolic, the forward orbit will strongly depend on the place of the starting point versus p. For attractive periodical points the following theorem can be proved:
Theorem Assume that ![]() and |(f n)’(p)| < 1. Then there is an open interval
and |(f n)’(p)| < 1. Then there is an open interval ![]() , such that for every
, such that for every ![]() :
:
![]()
According to the theorem above, there is an attractor of period n that is surrounded by an open interval I that is mapped inside itself by fn. This neighborhood is contained in the stable set. For repelling periodical points an analogous theorem exists:
Theorem Assume that ![]() and |(f n)’(p)| > 1. Then there is an open interval
and |(f n)’(p)| > 1. Then there is an open interval ![]() , such that for every xÎU\{p} there exists kÎN such that:
, such that for every xÎU\{p} there exists kÎN such that:
![]()
The interval U in the theorem above is contained in the local unstable set of p.
Example 1.2. The function ![]() has the fixed points: { -1, 0, 1}. Their stability can be determined with the derivative:
has the fixed points: { -1, 0, 1}. Their stability can be determined with the derivative: ![]() ,
, ![]() and
and ![]() . The points -1 and 1 are repelling fixed points and the point 0 is attractive. The forward orbits for the following startpoints: { -1.1, -0.8, 0.8, 1.1} are shown in the figure below.
. The points -1 and 1 are repelling fixed points and the point 0 is attractive. The forward orbits for the following startpoints: { -1.1, -0.8, 0.8, 1.1} are shown in the figure below.
Figure 1. The forward orbit O+(x0), where x0 is in {-1.1, -0.8, 0.8, 1.1}.
In figure 1, the local stable and unstable sets are shown: ![]() ,
, ![]() and
and ![]() . Alternatively the forward orbit O+ can be drawn as a function of
. Alternatively the forward orbit O+ can be drawn as a function of ![]() , see figure 2.
, see figure 2.
Figure 2. The first points of the forward orbits of ![]() .
.
If the function f is linear, (1.1) may then be written as a difference equation of the first order:
 |
(1.5) |
The behavior of the sequence Xt depends on the values of a, b and X0, as it is shown in (1.5). A thorough description can be found in [Gol58].
The classification of periodical points in multidimensional systems is done by the eigenvalues of the Jacobian matrix. The set of eigenvalues ![]() of the matrix A is denoted by
of the matrix A is denoted by ![]() . Assume that
. Assume that ![]() , where
, where ![]() , (k>1). The Jacobian matrix of the map f is denoted by Df and defined as the following:
, (k>1). The Jacobian matrix of the map f is denoted by Df and defined as the following:
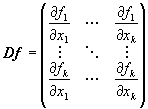
The eigenvalues of Df can be calculated from the equation: ![]() , where I is a
, where I is a ![]() -identitymatrix. Analogous to the one-dimensional case, the point p is said to be:
-identitymatrix. Analogous to the one-dimensional case, the point p is said to be:
A linear system of the form (1.1) can also be written as (a system of first order difference equations):
| Xt+1 =A Xt +b | (1.6) |
where A is a n-dimensional square matrix and X and b are vectors with n elements. The Jacobianmatrix to the system (1.6) is simply the matrix A, from which the stability of the periodical points can be determined. For linear multidimensional systems the following theorem has been proved:
Theorem Assume that Xt+1=L(Xt), where L is a linear map, ![]() . Then
. Then ![]() if and only if for every
if and only if for every ![]() , i=1, . . . , n.
, i=1, . . . , n.
Proof The theorem is proved for n=3 in pp. 175-176 of [Dev89].
Iteration of (1.6) gives:
X1=AX0+b
X2=AX1+b=A2X0+Ab+b
![]()
| Xk=AkX0+(Ak-1+ Ak-2 + . . . +A+I)b | (1.7) |
If I-A is invertible, i.e. 1 isn't an eigenvalue of A, we get:
(Ak-1+ Ak-2 + . . . +A+I)=(I-Ak)(I-A)-1
(1.7) can thus be written as:
| Xk= AkX0 + (I-Ak)(I-A)-1 b | (1.8) |
The behavior of discrete multidimensional systems with the eigenvalues of A may be summarized as the following [Sch96]:
|
l i , i=1, . . . , n |
X t , t® ¥ |
fixed point |
|
|l i| < 1, " i |l i| > 1, for some i |l i| £ 1, " i, |l i| = 1, for some i |
(I-A)-1 b ¡ ¡ |
attracting saddle nonhyperbolic |
Table 1. Possible behavior of a linear system Xt+1 =A Xt +b.
In the above table it is assumed that the startpoint isn't a fixed or a periodical point. The system might behave in different ways if the fixed point is a saddle or nonhyperbolic, depending on the startpoint.
If A is diagonalizable and one of its eigenvalues is 1, Ak can be expressed with the matrices S and D, where S is a matrix with the eigenvectors (of A) as columns and D is a diagonal matrix, which diagonal entries are l i , i=1, . . . , n, as the following:
Ak = (SD S -1) × × × (SD S -1)
= SD (S -1S)D (S -1S) × × × (S -1S)D S -1
= SD kS-1
(1.7) can thus be written as:
Xk= AkX0+(Ak-1+ Ak-2 + . . . +A+I)b
| = SD kS -1X0 +S(D k+ D k-1+ × × × + I)S -1b | (1.9) |
A is assumed to be diagonalizable, i.e. its eigenvectors are linearly independent. This means that the startpoint X0 can be written as a linear combination of the eigenvectors si, (i=1, . . . , n). We may then write X0 = c1s1+ c2s2+ . . .+ cnsn, and the following can be done:
X1 = AX0+b
= c1As1+ c2As2 + . . . + cnAsn + b
= c1l 1s1+ c2l 2s2+ . . . + cnl nsn+ b
![]()
Xk = c1l1ks1+ c2l2ks2 + . . . + cnl nksn + (Ak-1+ Ak-2 + . . . +A+I)b
| = c1l1ks1+ c2l2ks2 + . . . + cnlnksn + S (Dk-1+ Dk-2 + . . . + D + I) S -1b | (1.10) |
The system Xk depends strongly on the starting point. If some li is such that |li|>1 , i.e. the fixed point is a saddle, the system might diverge depending on the ci (this can be seen above).
If the matrix A is nondiagonalizable it can be written as: A=SJS -1 , where J is in Jordan form [Sch97]. In this case (1.7) can be written as:
| Xk = SJ kS -1X0 +S (J k+ J k-1+ . . . + I) S -1b | (1.11) |
A thorough analysis of (1.11) is found in [Sch97]. Generally, the behavior of linear systems doesn't, however, depend on the diagonalizability of A.
Nonlinear systems can, if |l i|#1 for every i, be approximated by linear functions in a neighborhood of the fixedpoints. Assume that the n-dimensional function f is nonlinear and that x* is a fixed point. f can then be approximated as:
| f(x) » Df(x-x*) + f(x*) | (1.12) |
The stability of periodical points of nonlinear systems can be determined by calculating the eigenvalues of Df and applying the theory of linear systems.
Example 1.3. The 2-dimensional map

has the following fixed points: ![]()
The eigenvalues of the Jacobianmatrix 
can be found by solving the equation det(l I-Df(xi*))=0, i=1,2,3. The eigenvalues of the Jacobian of the different fixed points and their behavior are shown in table 2.
| x* | l i , i=1,2 | |l i|, i=1,2 | Behavior of x* |
| x1* | 0.25± 1.35534i | 1.3782 | Repelling |
| x2* | 1.5745, -1.0745 | 1.5745,1.0745 | Repelling |
| x3* | 0.25± 0.90228i | 0.935275 | Attracting |
Table 2. The behavior of the fixed points of f(x).
The linearisation may fail if the real parts of the eigenvalues are 0. In such cases other methods can be used to determine the stability of the fixed points [Sch96].
Dynamical systems or time series that are described by linear difference equations may be rewritten to the general form (1.1) of a dynamical system, whereafter the theory can be applied. Consider a linear difference-equation of order k+1:
| Xt+1= a0Xt + a1Xt-1 + . . . + akXt-k | (1.13) |
Make the following substitution: ut=( ut0, ut1, . . . , utk)T =( Xt, Xt-1, . . . , Xt-k )T, into (1.13).
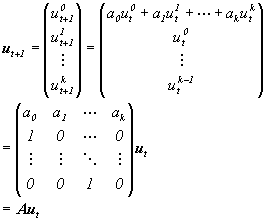 |
(1.14) |
The theory from previous chapters can then be used to analyze the behavior of (1.14). Consider the following linear difference equation of the second degree:
| Xt+1=aXt + bXt-1 | (1.15) |
Put as above:
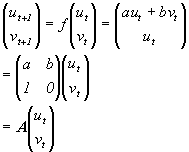
The eigenvalues of A can be calculated from:
 |
(1.16) |
The stability of the fixed point 0 can now be determined with the values of the parameters a and b.
The graphical analysis is very useful in creation of intuition and understanding of mathematical phenomena. Mathematical programs [Eme97], for example Matlab, Mathematica, Mathcad, Maple etc., are very easy to use for this purpose.
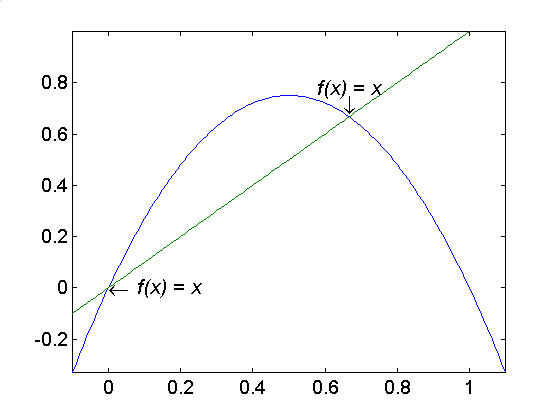
Fixed and periodical points can be calculated from the equations (1.2) and (1.3). They can also be determined by graphical analysis as the following: by drawing the function f(x) and the identity function id(x)=x, the fixed points are the points where f(x) and id(x) intersect. Analogously the periodical points can be found by drawing f n(x) and id(x).
Example 1.4. The fixed points: {0, 2/3} of the function f(x)=3x(1-x) can be solved from: 3x(1-x)=x.
The function doesn’t have any periodical points, which can be verified graphically:
 |
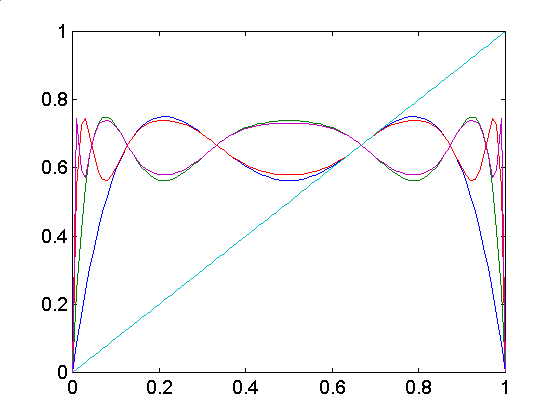 |
| Figure 3. The fixed points 0 and 2/3. | Figure 4. id(x) and f n(x), n=2,3,4,5. |
The behavior of different points may easily be visualized by drawing the first points of the forward orbit. Xt is put on the vertical axis and the time t on the horisontal axis. Alternatively the behavior can be analysed by first drawing the function f(x) and id(x) followed by a choice of startpoint X0. A horisontal line is then drawn from f(X0) to id(f(X0)). The point id(f(X0)) is now X1 , from which a line is drawn to f(X1). From f(X1) there is a line drawn to id(f(X1)), which is now X2. The procedure is repeated until some of the following events occur: an attracting fixed point is found, a periodical orbit is found or the system seems to diverge. The methods described above are used in figures 1 and 2, see examples. The forward orbit may also be drawn in two or three dimensions.
Changes in parameters may lead to changes in the number of or the behavior of, the fixed and the periodical points. Different kinds of bifurcations (bifurcation="split apart") may occur, for example attracting fixed points may become repelling or become periodical. The tangent bifurcation or saddle-node bifurcation means that two new fixed points are born from a fixed point, of which one is stable and the other is unstable. This can be verified with the following theorem [Dev89]:
Theorem Suppose that:
| 1. fl0(x*)=x*, | 2. fl0'(x*)=1, | 3. fl0''(x*)#0, | 4. |
Then there exists an interval I about x* and a smooth function p:I->R satisfying p(x*)=l0, such that fp(x)(x)=x.
Proof: [Dev89] pp. 88-89.
In a period-doubling bifurcation the periods are doubled and stable periodical points becomes unstable. This is the content in the following theorem [Dev89]:
Theorem Suppose that
| 1. fl0(x*)=x*, for all l in an interval about l0. | 2. fl0'(x*)=-1, | 3.  |
Then there is an interval I about x* and a function ![]() such that
such that ![]() but
but ![]() .
.
Proof: [Dev89] pp. 90-91.
In a transcritical bifurcation two fixed points are joined and then splitted apart. The different bifurcations can be seen from the following example.
Example 1.5. Consider the function fa(x)=x2+a. Its fixed points are ![]() . The different bifurcations that occur can be seen in table 3.
. The different bifurcations that occur can be seen in table 3.
|
a |
|f’(x*l)| , l=1,2 |
bifurcation type |
|
a<-3/4 a=-3/4 -3/4<a<1/4 a=1/4 a>1/4 |
1<|f’(x*1)|< |f’(x*2)| |f’(x*1)|=1, |f’(x*2)|=3 |f’(x*1)|<1<|f’(x*2)| |f’(x*1)|= |f’(x*2)|=1 |f’(x*1)|= |f’(x*2)|>1 |
- - period-doubling - - saddle, transcritical - - |
Table 3. Fixed points of fa(x).
Note that if a=1/4, both a saddle and a transcritical bifurcation occur, x1*=x2*=1/2. For a>1/4 the fixed points are complex [Dev89]. The absolute values of the derivatives in the fixed points are then:  .
.
Graphical analysis visualizes the behavior of the real fixed points, see figure 5.
Figure 5. The graph of fa(x)=x2+a, for aÎ {-3/2, -3/4, 0, ¼, 1}.
For a<1/4 the function has two real fixed points (of which the larger is repelling) and for a=1/4 these coincide. This can be seen in figure 5.
Bifurcations also occur in two- and higher-dimensional systems. In two dimensions a unique type of bifurcation may occur, i.e. the Hopf-bifurcation. In a Hopf-bifurcation attractive fixed points become reppelling and an attracting closed invariant curve is born. This occurs when the eigenvalues cross the unitcircle [Dev89].
The different types of bifurcations can be visualised by so-called bifurcation diagrams. In such a diagram the stable fixed and periodical points are drawn as functions of the parameter [Dev89]. The bifurcation diagram for fa(x) in example 1.5 is shown in figure 6. The diagram is made by iterating fa(x) 1000 times for a-values between –2 and ¼. The last 100 points of each iteration is finally plotted at each a-value.
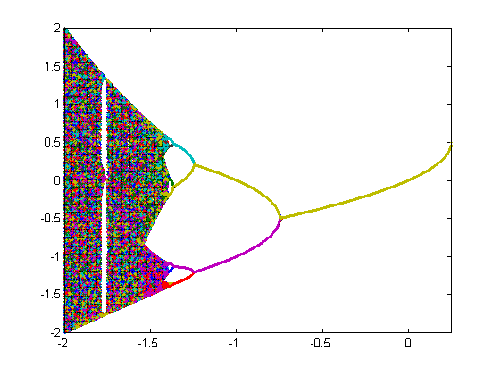
Figure 6. Bifurcationdiagram for fa(x)=x2+a, aÎ [-2,1/4].
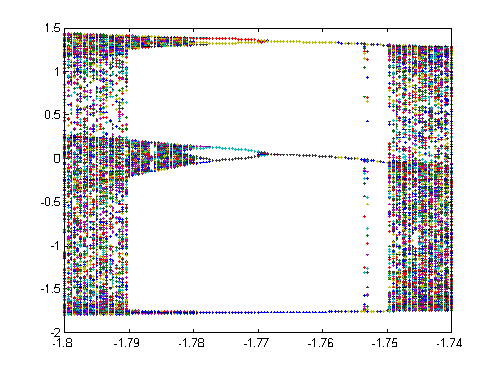
Figure 6 above shows that fa has an attracting fixed point when a is within [-1/2-e,1/4] and the first perioddoubling occurs at the point a=-1/2-e , (e >0). The perioddoublings occur more often the smaller the a is and they seem to converge to a limit point, ac. For a< ac the function is chaotic, which can be seen from the figure as a black region [Dev89]. By zooming in the figure for a-values within [-1.8,-1.7] (see figure 7) an attracting 3-period cycle can be detected for a» -1.76. Figure 7 shows that for a<-1.76 a periodoubling occurs followed by a 6-periodic cycle that is followed by a 12-periodic cycle.
 |
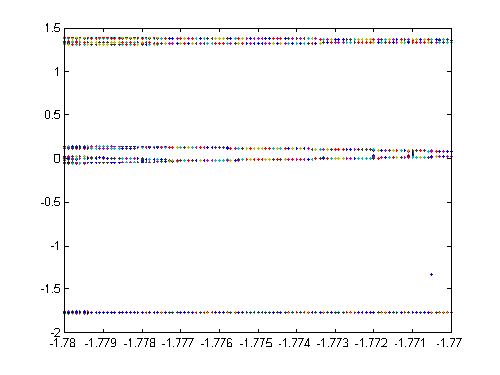 |
Figure 7. Enlargements of figure 6.
Approximations of parameter values when bifurcations occur can be done by zooming in the diagrams as it is done above.
Feigenbaum [Fei78] did the notation that for the logistic map (fm (x) = m x(1-x), m Î [0,4], xÎ [0,1]) the parameter values (when the bifurcations occur) can be calculated from:
 |
(1.17) |
The word chaos is used in many contexts in daily life, i.e. a desk may look chaotic, someones life may seem to be chaotic. Here the mathematical meaning of chaos is used, which doesn’t refer to any "disorder" or any "mess". Despite the popularity of chaos in recent years, there has not been any universally accepted mathematical definition of chaos [Ban92]. According to [Dev89] a chaotic system has the following three components: topological transitivity, sensitive dependence on initial conditions and dense periodical points. The first ones are defined as:
Definition f:V®V is topologically transitive if there exists a natural number k for all non-empty subsets I and J of V, such that f k(I)Ç J#Æ.
Definition f:V® V is sensitive dependent on initial conditions if there is a real number d >0, such that for every xÎ V and for every e >0 there exist y and nÎN such that: | x-y | < e and | f n(x)- f n(y) | > d .
With the definitions above and the definition 1.1 (density of periodical points) chaos can , according to [Dev89], be defined on metric spaces as the following:
Definition 1.2. Let V be a metric space. A continuous map f:V® V is said to be chaotic on V if:
According to the first criteria (i) in the definition above, a chaotic system isn’t reducible. Because of the density of periodical points, some regularity exists. The third criteria is considered as the main criteria for chaotic systems (also known as the "Butterfly"-effect). According to this criteria, minute differences can lead to large scale divergency. A redundancy has been found in definition 1.2. because [Ban92] has proved the following theorem:
Theorem 1.1. If f:V® V is transitive and has dense periodical points then f has sensitive dependency on initial conditions.
If I is an interval on the real axis, it is (for chaos) enough to show that the map is topologically transitive, because of the following theorem that has been proved by [Vel94]:
Theorem 1.2. Let I be a, not necessarily finite, interval and f:I® I a continuous and topologically transitive map. Then
Sometimes it is easier to investigate another similar map g to determine if a map f is chaotic or not. This is possible if the maps are topologically conjugate.
Definition The maps ![]() are said to be topologically conjugate if there exists a homeomorphism
are said to be topologically conjugate if there exists a homeomorphism ![]() ,(i.e. h is injective, surjective, continuous and h -1 is also continuous), such that, h(f(x))=g(h(x)).
,(i.e. h is injective, surjective, continuous and h -1 is also continuous), such that, h(f(x))=g(h(x)).
The sensitive dependency may be examplified with a pinball machine [Lor93]. In figure 8 three different paths of a ball are drawn. The paths from the first pin are dependent of the following factors (parameters): the speed and angle of the ball as it arrives at the pin, friction and other disturbances. Small deviations in these factors give totally different paths because the paths are sensitively dependent on the initial conditions. The model fails to provide a perfect example of chaos since the chaotic behavior ceases after the last pin is struck.
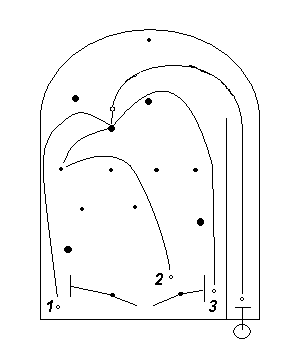
Figure 8. Sensitive dependency on initial conditions in a pinball machine.
Some examples of chaotic maps:


Figures of the tent and baker maps are found in the function_plot applet.
The errors that occur when functions are being iterated with computers might in many cases lead to results that are totally wrong. A system migth behave totally different depending on the precision of the chosen program (the program that does the iterations). Consider an iteration of the baker map B(x).Choose the following starting points: the rational number 4/7 and 0.6, which are periodical with the periods 3 and 4. Note that 4/7 is 0.57142857142857... in decimal form, i.e. the decimal comma is followed by an infinite sequence of the numbers 571428. Such numbers will be truncated in computers, i.e. 0.57142857142857... will be truncated to an finite sequence. In a program that calculates with 16 decimals the number 0.6 will be rounded to 0.6000000000000000. The forward orbit of the baker map, calculated exact and numerically with Matlab, is shown in table 4.
| k | B k(4/7) | B k(4/7), (Matlab) | B k(0.6) | B k(0.6), (Matlab) |
| 0 | 4/7 | 0.5714285714285714 | 0.6 | 0.6000000000000000 |
| 1 | 1/7 | 0.1428571428571428 | 0.2 | 0.2000000000000000 |
| 2 | 2/7 | 0.2857142857142856 | 0.4 | 0.3999999999999999 |
| 3 | 4/7 | 0.5714285714285712 | 0.8 | 0.7999999999999999 |
| 4 | 1/7 | 0.1428571428571423 | 0.6 | 0.5999999999999999 |
| : | : | : | : | : |
| 48 | 4/7 | 0.5625000000000000 | 0.6 | 0.5937500000000000 |
| 49 | 1/7 | 0.1250000000000000 | 0.2 | 0.1875000000000000 |
| 50 | 2/7 | 0.2500000000000000 | 0.4 | 0.3750000000000000 |
| 51 | 4/7 | 0.5000000000000000 | 0.8 | 0.7500000000000000 |
| 52 | 1/7 | 1 | 0.6 | 0.5000000000000000 |
| 53 | 2/7 | 1 | 0.2 | 1 |
Table 4. Iteration of B(x), exactly and numerically with Matlab.
The exact values of B k(4/7) and B k(3/5) can be calculated with Mathematica, roundoff.nb. Iteration with decimal numbers like 0.6 also leads to wrong results within Mathematica. Table 4 shows that the iterations made by Matlab gives totally wrong results. The example proves that one shouldn't only rely on calculations done by computer programs. You may try this with the roundoff-applet.
| Contents | Chapter 2 | Chapter 3 | Copyright 1998 | Stefan.Emet@abo.fi |