A Short Tutorial
We assume that you have a set of compounds and the corresponding activity values available. We also assume that you have some basic knowledge about how to run command-line programs.
Generating QSAR models
- (optional) Create conformers for your compounds using whatever program you want (or have access to). You may want to try BALLOON - it's available under the same license terms as McQSAR, i.e., free of charge.
-
Calculate descriptors for the set of compounds. Save the descriptor data in SD file format or as an ASCII text file, the latter preferably with column and row headers (corresponding to descriptor and compound names).
JOElib is an excellent open-source tool for this purpose.
PaDEL-Descriptor is another open-source tool for the computation of molecular descriptors.
A list of other descriptor calculation software is given here. -
Generate a default parameter file
mcqsar --writeparams filename
Open the generated file in a text editor (e.g. Notepad on Windows). -
Execute McQSAR with option '--help' -> A lot of output about different options. Read that output and edit the parameter file as necessary. You must provide the name of the dependent variable and the input and output files:
input-file = infile1 infile2 ...
Comment out unnecessary lines by using the hash character '#' as the first character on the line.
output-file = outifle
Execute McQSAR again, this time with the parameter file
mcqsar -p filename
The resulting QSAR models will be written to the output file.Predicting activity
- Choose the model(s) you want to use for prediction from the output file (generated above). Copy and paste them to a separate text file.
- Calculate descriptors for the compounds you want to predict the activity for. You only need to calculate those descriptors that appear in the equations you use for the prediction. Save the data in ASCII text or SD file format. For ASCII, be sure to include the row headers (compound names) and column headers (descriptor names).
- Execute McQSAR with the '-P' switch (see program's default output for command syntax). Predictions are now written to the output file.
Representation of equations
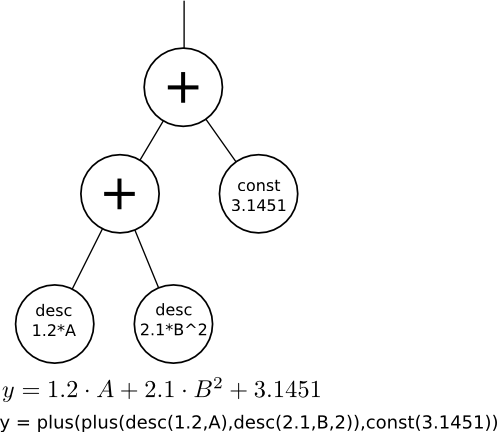
McQSAR represents mathematical equations as tree data structures as shown above. A tree consists of hierarchical layers of nodes with parent/child relationships. Those nodes that have child node(s) are operators,
i.e., they perform calculations on the values returned by their child node(s). In the McQSAR output, the above equation would be written as
y = plus(plus(desc(1.2,A),desc(2.1,B,2)),const(3.1451))
Binary operators have two child nodes:
- maximum, "max"
- Return the maximum value of those of the children
- minimum, "min"
- Return the minimum value of those of the children
- addition, "plus"
- Return the sum of the values of the children.
- multiplication, "mul"
- Return the product of the values of the children.
- division, "div(dividend,divisor)"
- Return the value of the left child divided by the value of the right child.
- topower, "pow(base,exponent)"
- Return the value of the left child raised to the power of the value of the right child. Results in very steep functions.
average, "avg"Return the average of the values of the children.Deprecated since v1.2.4, which will read in equations with "avg" operator but write them out in a transformed but mathematically equivalent format.
- exponential, "exp"
- Return e to the power of the value of the child.
- negation, "neg"
- Return the negation of the value of the child.
- logarithm, "log"
- Return the natural logarithm of the absolute value of the child.
- squareroot, "sqrt"
- Return the square root of the absolute value of the child.
- Gaussian, "gauss(µ,A,σ,descriptor_name)"
- Gaussian function in one dimension. See e.g. Gaussian in Wikipedia.
The one-dimensional Gaussian has the functional form
f(x) = A * exp{ -(x-µ)2 / 2σ2 }
where A is the amplitude of the Gaussian, µ is the mean (location of the maximum), x is the descriptor value, and σ2 is the variance (affects the width of the curve). - constant, "const(value)"
- Returns the value of the constant.
- descriptor, "desc(coefficient,descriptor_name,exponent)"
- Returns the value of the descriptor raised to the exponent multiplied with the coefficient. The default exponent of one is not written out.
- spline(knot,descriptor_name)
- Returns the descriptor value subtracted by knot value if the result is positive. Otherwise return zero.
- quadraticspline, "qspline(knot,descriptor_name)"
- Returns the descriptor value subtracted by knot value to the power of 2, if the result of the subtraction is positive. Otherwise return zero.